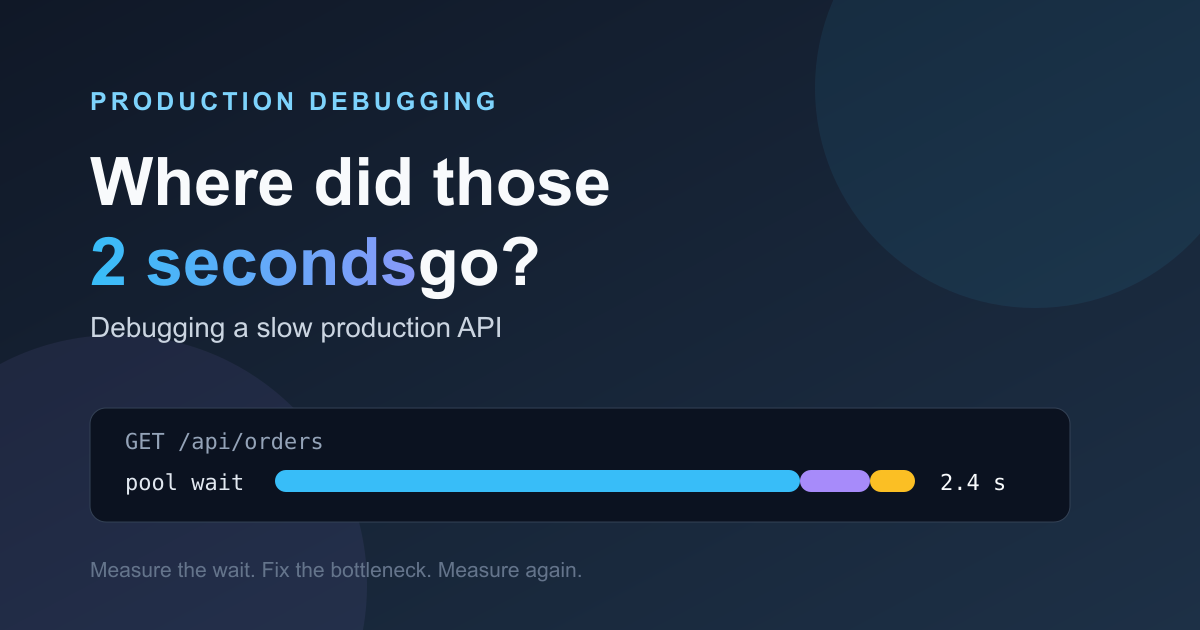
GET /api/orders takes 82 ms on a local machine.
It is deployed to production and now takes 2.4 seconds.
Same endpoint. Same application code. Similar SQL.
So what happened?
The database is usually the first suspect. But a “slow database” can mean several different things: waiting for a connection, making too many database round trips, waiting on a lock, crossing a network, or running an expensive query. The user only sees one slow response.
The rule I use is:
Do not optimise the thing that looks slow. Measure what the request is waiting for.
In this article, I use GET /api/orders as the running example. For each possible cause, I will cover:
Symptom → Why it happens → How to prove it → How to fix it → Trade-offs
Start by splitting API time
Before changing an index or increasing a connection pool, first split the request into measurable parts. This prevents us from solving the wrong problem.
Total API latency
├── application work
├── connection-pool wait
├── database execution
├── lock wait
├── network time
└── response serialisation
For example, the 2.4-second GET /api/orders response might break down like this:
Pool wait:          1,620 ms
Query execution:       48 ms
Network overhead:     142 ms
Application work:     590 ms
────────────────────────────
Observed latency:   2,400 ms
Here, the SQL is already fast. Adding an index would not help because the application is spending most of its time waiting for a connection. That distinction is important: is the database slow, or are we waiting to access the database?
1. Too many database round trips
Symptom
The database reports fast individual queries, but the API endpoint is still slow. The problem gets worse when the endpoint returns more records.
Why it happens
Every query has a round trip: the application sends a request, the database executes it, and the result comes back. Small delays add up quickly when a request makes many calls.
For GET /api/orders, the most common example is an N+1 query. It is easy to introduce without noticing in otherwise readable application code:
orders = get_orders()

for order in orders:
    order.customer = get_customer(order.customer_id)
For 100 orders, this can create:
1 query for orders
+ 100 queries for customers
= 101 database round trips
How to prove it
- Count SQL statements per API request in application tracing.
- Check whether the same query shape repeats with a different ID.
- Compare request time for 10, 50, and 100 records.
What I would change
Fetch related data together when the result size is reasonable:
SELECT
  o.id,
  o.total,
  c.name AS customer_name
FROM orders AS o
JOIN customers AS c
  ON c.id = o.customer_id;
This can reduce 101 round trips to one. In an ORM, the equivalent is usually eager loading or batching. After the change, trace the endpoint again and confirm that the SQL count actually dropped.
Trade-offs
One very large join can return duplicate data or too many rows. For large collections, batching or two focused queries may be better than one giant join. The goal is not always one query—it is the right number of queries for the response.
2. Connection-pool exhaustion
Symptom
Requests spend time waiting before any SQL starts. Database CPU may be low, but API latency rises during traffic spikes. In traces, look specifically for connection acquisition time.
Why it happens
An application uses a connection pool to limit concurrent database connections. If every connection is busy, the next request waits in line.
The first reaction is usually to increase pool_size. That can hide the symptom, but it can also make the database less stable. Consider a service that scales horizontally:
10 application pods × 50 connections = 500 possible connections
30 application pods × 50 connections = 1,500 possible connections
Giving every pod a large pool can overload the database and make performance worse.
How to prove it
- Record connection acquisition time separately from SQL execution time.
- Monitor active, idle, and waiting connections.
- Check for transactions that stay open longer than expected.
- Look for connection leaks where connections are checked out but not released.
What I would change
- Keep transactions short.
- Always release connections through a context manager or framework lifecycle hook.
- Set a realistic pool limit for database capacity and the number of application instances.
- Add queueing or backpressure so a traffic spike does not create unlimited work.
async with session_factory() as session:
    result = await session.execute(query)
    return result.mappings().all()
Trade-offs
A smaller pool can increase application-side waiting during bursts, but it protects the database. A larger pool can reduce short-term waiting while increasing database contention. Measure both the application and database before changing limits.
3. Lock waits and transaction contention
Symptom
A query appears slow, but the execution plan is good and database CPU usage is normal. Latency is inconsistent and often happens during concurrent updates.
Why it happens
The query may be waiting for another transaction to release a lock.
Transaction A                 Transaction B
BEGIN                         BEGIN
UPDATE inventory ...
lock held

                              UPDATE inventory ...
                              waiting for lock

COMMIT
                              continues and commits
The actual SQL may need only 5 ms of work, while the user observes 1,805 ms:
Execution time:      5 ms
Lock wait:       1,800 ms
──────────────────────────
Observed time:   1,805 ms
How to prove it
- Inspect the database’s active-session and lock-wait views.
- Trace transactions that are open for an unusually long time.
- Check whether slow requests overlap with writes to the same records.
What I would change
- Move network calls, file operations, and slow business logic outside the transaction.
- Update shared resources in a consistent order.
- Add indexes so updates find and lock fewer rows.
- Use optimistic concurrency when conflicts are acceptable to retry.
Trade-offs
Short transactions improve concurrency but may require a redesign if a business operation assumes a long transaction. Optimistic locking can create retry handling. Choose it only when the user experience can safely handle a conflict.
4. Missing or poorly targeted indexes
Symptom
Queries become slower as data grows. The query plan shows a sequential scan over a large table, or it scans far more rows than it returns.
Why it happens
Without an appropriate index, the database may need to inspect many rows to find a small result set.
How to prove it
Use EXPLAIN (ANALYZE, BUFFERS) on a representative read query in a safe environment.
Production caution: EXPLAIN ANALYZE executes the statement. Be particularly careful with INSERT, UPDATE, and DELETE, and do not run an expensive plan against production traffic without understanding its impact.
EXPLAIN (ANALYZE, BUFFERS)
SELECT id, created_at
FROM orders
WHERE customer_id = 42
  AND status = 'open'
ORDER BY created_at DESC
LIMIT 20;
Look for a sequential scan, high rows scanned, or most time spent reading buffers.
What I would change
Create an index that matches the filter and sort pattern the endpoint really uses. Do not create an index just because a column appears in a WHERE clause.
CREATE INDEX CONCURRENTLY idx_orders_customer_status_created_at
ON orders (customer_id, status, created_at DESC);
The order is intentional. The index starts with the equality-filtered columns, customer_id and status, followed by created_at DESC, which matches the required ordering. This lets PostgreSQL efficiently seek to the relevant rows and stop early once 20 results have been found. An index starting with created_at would not serve this query as directly.
After adding it, run the same plan again and compare endpoint latency under representative load. The index is only useful if it improves the real request, not just a local query test.
Trade-offs
Indexes improve reads, but they use storage and add work to inserts, updates, and deletes. Do not index every column used in a WHERE clause. Index the queries that matter, and remove indexes that provide no value.
5. Bad query plans or stale statistics
Symptom
An index exists, but the database still chooses an inefficient plan. Estimated rows are very different from actual rows in EXPLAIN ANALYZE output.
Why it happens
The query planner makes decisions from table statistics. If the data distribution has changed or the query hides useful information, the planner can choose the wrong join order or scan type.
How to prove it
Compare estimated and actual row counts in the plan:
Seq Scan on orders
  estimated rows=100
  actual rows=250000
The planner made its decision expecting about 100 rows. In reality, it read 250,000. A plan that looked fine for 100 rows can become expensive under real workload. This gap is a strong sign that the plan is working from inaccurate assumptions.
What I would change
- Refresh statistics according to the database’s maintenance process.
- Rewrite the query so filters are clear and index-friendly.
- Check data types and avoid unnecessary casts on indexed columns.
- Reconsider the index or schema if the workload has changed.
Trade-offs
Query rewrites can make code less obvious, and maintenance jobs consume resources. Prefer a clear query and a targeted index before adding complex hints or database-specific workarounds.
6. Network and response overhead
Symptom
Database logs show a fast query, but the application still observes high latency—especially when the application and database are in different regions or the response contains a lot of data.
Why it happens
The application may be paying for cross-region latency, many small calls, large result sets, or expensive JSON serialisation.
How to prove it
- Compare database execution time with application trace time.
- Measure response payload size.
- Check where the application, database, and cache are deployed.
- Test the same query locally and through the real application path.
What I would change
- Keep the application and database in the same region where possible.
- Return only fields the client needs.
- Paginate large result sets.
- Batch related reads.
- Cache stable, frequently requested data where correctness allows it.
Trade-offs
Caching improves speed but introduces invalidation and freshness decisions. Smaller payloads may require a second endpoint for a detailed view. Optimise the data contract deliberately rather than returning everything by default.
How I see where the time went
The investigation only works if the endpoint has useful measurements. For GET /api/orders, an application trace might look like this:
Request trace
├── authentication        12 ms
├── application work     590 ms
├── acquire connection 1,620 ms
├── SQL #1                18 ms
├── SQL #2                30 ms
├── serialisation         43 ms
└── network / proxy       97 ms

                       2,400 ms
This trace changes the conversation immediately. The database is not spending 2.4 seconds executing SQL. The application is spending 1.62 seconds waiting to acquire a connection.
In production, I would use a combination of application tracing or APM, database slow-query logs, pool metrics, query counts, lock views, and EXPLAIN plans. Tool names differ, and not every tool separates execution time from wait time in the same way. The important part is to separate actual database work from time spent waiting wherever the instrumentation allows it.
Common fixes I would not make without evidence
✗ API is slow             → add an index
✗ Connections are busy    → increase pool_size
✗ Database CPU is high    → scale the database
✗ Repeated reads          → cache everything
✗ Query is slow           → rewrite the SQL

✓ Measure → identify the wait → make a focused change → measure again
A production debugging sequence
When I am investigating a slow API, I use this order before changing any configuration or schema:
1. Measure end-to-end API latency.
2. Separate actual execution work from wait time wherever the instrument can.
3. Count SQL statements per request.
4. Inspect slow queries and active lock waits.
5. Run EXPLAIN (ANALYZE, BUFFERS) on representative read queries.
6. Check indexes and statistics.
This sequence prevents a common production mistake: applying a familiar fix before proving the cause.
Closing the investigation
For this example, the trace showed that the main problem was not SQL execution. It was time spent waiting for a database connection.
Before
GET /api/orders → 2,400 ms

Investigation
└── 1,620 ms waiting to acquire a database connection

Changes
├── shortened transaction lifetime
├── fixed connection handling
└── tuned pool limits against database capacity

After
GET /api/orders → 310 ms
The exact fix will be different in every system. Connection pooling is not always the answer. In this example, measurement showed that it was the bottleneck.
Final takeaway
A slow API is not always caused by a slow database query. It is a system problem until measurement shows where the time is being spent.
Start with the request timeline. Identify whether the time is spent waiting for a connection, making too many queries, waiting on locks, executing SQL, crossing the network, or serialising the response. Fix the measured bottleneck, then measure again.